
2.4 THE Q SCORE
Because AAU metrics have great importance to marketers, and for the fact that there is no one-size-fits-all approach to evaluating the variables, many digital marketing companies like Salesforce, Microsoft, HubSpot, Oracle, Zendesk and others are investing more in Research and Development (R&D) to stay in tune with technology trends and changing consumer habits. One of the advanced proprietary systems for evaluating AAU variables in the United States, particularly likeability, is the Q Score (Kozielski et al, 2017; Uhm et al, 2022)
Q Score is a reliable tool for measuring the attractiveness and popularity of a brand (such as companies, products, TV shows, celebrities etc). It is widely used in the digital marketing, media, advertising, and public relations industries. Designed by Jack Landia in 1963, the Q Score 9 also known as Q factor or simply Q) is owned by Marketing Evaluations (a New York-based company offering services such as opinion polls and market research for advertising agencies and marketers). Like Salesforce, Q Score provides real-time information, data-based analysis, and interpretations about the extent to which consumers like or dislike certain brands, products, celebrities and more (Williams & Koekpe, 2006). Both digital marketing companies—Salesforce and Q Score—are reputable for sieving complex data and presenting it in a single measurement with the following ratings:
A. One of my favourites
B. Very Good
C. Good
D. Fair
E. Poor, and
F. Never heard of
Among all metrics and concepts relating to AAU, “likeability” is preferred for various reasons. Q Scores function with direct responses from consumers. Although the Q Scores system is sophisticated, its popularity and success in the marketing domain are well earned because the model encourages use of research correspondents (consumers) who know the brand and are willing to share their preferences (Xue & Deng, 2012).
The formula for calculating positive Q Score is:
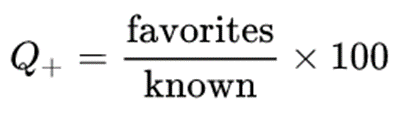
In quantitative evaluations, the Q Score is calculated by checking the number of research respondents who answered “A,” dividing the sum by the number of those who gave answers ranging from A to E (that is, A, B, C, D or E), and working out the percentage by multiplying the fraction by 100.
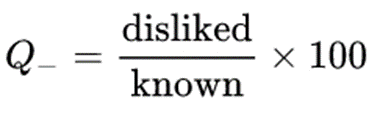
{\displaystyle Q_{+}={\frac {\text{favorites}}{\text{known}}}\times 100}The negative Q Score is also checked by adding the percentage of consumers (research participants) who answered D or E relative to others in the group who answered A to E as follows:
Numerous metrics (such as Nielsen ratings) have been used to check the likeability, popularity, or appeal of brands, but Marketing Evaluations considers Q Score as the most effective tool for marketers seeking understanding of the link between brand awareness and intent data. The company has different categories of Q Scores vis-a-vis:
Table 2.4: Categories of Q Score Ratings
| Q Score Category | Description |
| Brand Attachment Q | Rates brand and company names |
| Cable Q | Rates cable television programs |
| Cartoon Q | Rates cartoon characters, video games, toys, and similar products |
| TVQ | Rates broadcast television programs. |
| Performer Q | Rates living celebrities. |
| Sports Q | Rates sports figures |
| Kids Product Q | Rates children’s responses to brand and company names |
| Dead Q | Rates the current popularity of deceased celebrities. |
Source: Irobiko Chimezie Kingsley (2022)
Leave a Reply