
4.1 Introduction
This chapter presents and analyses the data collected for the study on the relevance of social media indulgence on the mental health of Nigerian youths. The analysis is based on a mixed-method approach that combines quantitative data from questionnaires and qualitative data from semi-structured interviews. The purpose of this chapter is to present findings clearly, systematically, and transparently, using simple descriptive statistics and participants’ direct words to explain observed patterns.
Quantitative data from 115 questionnaire respondents are analysed using frequencies, percentages, mean scores, median values, and standard deviation. These statistics are used to identify dominant trends rather than to test causal relationships. Also, qualitative data from 20 interview participants are analysed thematically, with verbatim quotations from participants used to support interpretation. The integration of both forms of data strengthens the credibility and depth of the findings.
The chapter is organised into sections that align with the study objectives: demographic characteristics, social media usage patterns, social media indulgence, emotional and psychological experiences, socio-economic pressures, relational tethering, content exposure, mental health outcomes, coping strategies, and an integrated presentation of quantitative findings.
4.2 Demographic Characteristics of Respondents
This section presents the background information of questionnaire respondents. Understanding demographic distribution is important for contextualising social media use and mental health experiences among Nigerian youths.
Table 4.1: Demographic Characteristics of Questionnaire Respondents (n = 115)
| Variable | Category | Frequency | Percentage (%) |
| Age | 18–22 | 34 | 29.6 |
| 23–27 | 41 | 35.7 | |
| 28–32 | 27 | 23.5 | |
| 33–35 | 13 | 11.3 | |
| Gender | Male | 62 | 53.9 |
| Female | 49 | 42.6 | |
| Prefer not to say | 4 | 3.5 | |
| Employment Status | Student | 46 | 40.0 |
| Employed (formal) | 29 | 25.2 | |
| Self-employed | 24 | 20.9 | |
| Unemployed | 16 | 13.9 |
Source: Research Data (2026)
The table shows that most respondents fall within the 23–27 age group. This result indicates young adults in early adulthood are strongly represented. Male respondents slightly outnumber females. Students and employed youths together form a majority, suggesting that the sample captures individuals balancing education, work, and digital engagement.
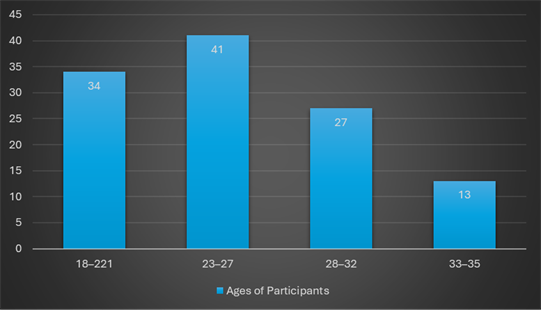
Figure 4.1 Age Distribution of Respondents
Source: Research Data (2026)
Figure 4.1 presents the age distribution of the 115 questionnaire respondents using a bar chart. The chart shows that the largest proportion of respondents falls within the 23–27 age group, followed by those aged 18–22 and 28–32. Together, these three categories account for the majority of the sample.
Specifically, respondents aged 18–22 years represent 29.6% of the sample, those aged 23–27 years constitute 35.7%, and respondents within the 28–32 years category account for 23.5%. In contrast, the 33–35 age group has the smallest representation, comprising 11.3% of respondents.
Overall, the bar chart shows that respondents are predominantly concentrated between 18 and 32 years, with a gradual decline in frequency as age increases beyond this range. This distribution indicates that the sample is weighted toward younger age groups within the study’s defined youth population.
4.3 Social Media Platforms and Usage Intensity
This section examines the platforms used by respondents and the time spent on social media daily.
Table 4.2: Social Media Platforms Used by Respondents
| Platform | Frequency | Percentage (%) |
| 109 | 94.8 | |
| 87 | 75.7 | |
| 69 | 60.0 | |
| TikTok | 64 | 55.7 |
| X (Twitter) | 51 | 44.3 |
| YouTube | 78 | 67.8 |
Source: Research Data (2026)
Data on Table 4.2 shows that WhatsApp records the highest level of usage among respondents. A total of 109 users (94.8%) indicated they use the platform. This is followed by Instagram (75.7%), YouTube (67.8%), Facebook (60.0%), and TikTok (55.7%). X (formerly Twitter), which has the lowest reported activity with 44.3% of respondents indicating use. Overall, the Table 4.2 shows that multiple platforms are widely used among Nigerian youth, with WhatsApp clearly standing out as the most active platform among the respondents.
Table 4.3: Average Daily Time Spent on Social Media
| Hours per Day | Frequency | Percentage (%) |
| Less than 1 hour | 7 | 6.1 |
| 1–3 hours | 31 | 27.0 |
| 4–6 hours | 46 | 40.0 |
| 7–9 hours | 21 | 18.3 |
| More than 9 hours | 10 | 8.7 |
Source: Research Data (2026)
The distribution of daily time spent on social media shows that 67.0% of respondents spend four hours or more per day on social media platforms. Specifically, 40.0% report spending 4–6 hours, 18.3% spend 7–9 hours, and 8.7% spend more than 9 hours daily. In contrast, 27.0% of respondents spend 1–3 hours, while 6.1% report spending less than one hour per day.
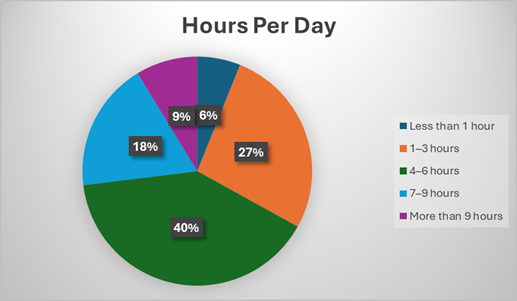
Figure 4.2: Daily Time Spent on Social Media
Source: Research Data (2026)
The pie chart highlights that moderate-to-high usage dominates the sample, supporting the relevance of examining indulgence rather than simple access.
4.4 Social Media Indulgence: Descriptive Statistics
This section presents respondents’ levels of social media indulgence based on habitual, emotional, and cognitive engagement.
Table 4.4: Descriptive Statistics for Social Media Indulgence Items
| Item | Mean | Median | Std. Deviation |
| Frequent unplanned checking | 3.92 | 4.00 | 0.84 |
| Restlessness without access | 3.68 | 4.00 | 0.91 |
| Difficulty reducing usage | 3.74 | 4.00 | 0.88 |
| Social media as part of identity | 3.59 | 4.00 | 0.93 |
Source: Research Data (2026)
The descriptive statistics show that all social media indulgence items have mean scores above 3.5, with observed values ranging from 3.59 to 3.92. The median score for each item is 4.00, indicating that the central response category selected by respondents is consistent across all measures. Standard deviation values fall between 0.84 and 0.93, showing that individual responses are clustered relatively close to the mean. This pattern indicates that responses are not widely dispersed and that similar response levels are reported across the sample for each indulgence item.
4.5 Emotional and Psychological Engagement
This section explores how social media content and interactions affect respondents’ emotions.
Table 4.5: Emotional Engagement with Social Media
| Statement | Mean | Std. Deviation |
| Mood influenced by content | 3.81 | 0.89 |
| Emotional investment in likes/comments | 3.76 | 0.92 |
| Positive feedback boosts self-esteem | 3.84 | 0.87 |
| Negative feedback affects emotions | 3.69 | 0.95 |
Source: Research Data (2026)
The descriptive statistics for emotional engagement indicate that respondents report notable emotional responses associated with social media use. Mean scores across the measured items range from 3.69 to 3.84, with relatively low standard deviation values. This shows consistent reporting among respondents. These items capture key emotional dimensions, including mood influence, emotional investment in online feedback, and sensitivity to positive and negative interactions. The distribution of responses indicates that emotional reactions to social media content and interactions are commonly reported across the sample.
4.6 Performative Hustle and Socio-Economic Pressure
This section examines how economic realities influence social media engagement.
Table 4.6: Performative Hustle Indicators
| Item | Mean | Std. Deviation |
| Pressure to appear successful | 3.88 | 0.86 |
| Social media linked to income opportunities | 3.71 | 0.90 |
| Fear of losing relevance | 3.65 | 0.94 |
| Posting as responsibility | 3.54 | 0.97 |
Source: Research Data (2026)
The descriptive statistics (on Table 4.6) measures performative hustle and socio-economic pressure associated with social media engagement. It presents the mean scores and standard deviations for four indicators capturing perceptions of economic pressure and performance-related expectations on social media.
The item “pressure to appear successful” records the highest mean score (M = 3.88, SD = 0.86), indicating a high level of agreement among respondents. This is followed by “social media linked to income opportunities” (M = 3.71, SD = 0.90) and “fear of losing relevance” (M = 3.65, SD = 0.94). The item “posting as responsibility” records the lowest mean score among the four (M = 3.54, SD = 0.97), though it remains above the scale midpoint.
Standard deviation values across the items range from 0.86 to 0.97. This indicates moderate variability in responses but overall consistency across the sample. Collectively, the table shows that respondents report similar levels of agreement across all performative hustle indicators measured.
4.7 Relational Tethering and Social Obligation
Table 4.7: Relational Tethering Items
| Item | Mean | Std. Deviation |
| Obligation to respond to messages | 3.90 | 0.82 |
| Guilt when ignoring online interactions | 3.72 | 0.89 |
| Social media maintains relationships | 4.02 | 0.78 |
Source: Research Data (2026)
Data on Table 4.7 measures relational tethering in social media use. The table reports the mean scores and standard deviations for three indicators related to online relational expectations and maintenance.
The item “social media maintains relationships” records the highest mean score (M = 4.02, SD = 0.78), indicating strong agreement among respondents. This is followed by “obligation to respond to messages” with a mean score of 3.90 and a standard deviation of 0.82.
The item “guilt when ignoring online interactions” has a mean score of 3.72 and a standard deviation of 0.89. All mean values are above the midpoint of the measurement scale, and the standard deviation values are below 1.00, indicating limited variability in responses.
Information on Table 4.7 therefore shows consistently high mean scores across all relational tethering items, with relatively low dispersion. This result suggests a similar response pattern among respondents for the relational dimensions measured.
4.8 Content Exposure and Algorithmic Experience
Table 4.8: Content Exposure and Emotional Impact
| Content Type | Mean Impact Score |
| Wealth and success content | 3.89 |
| Political news | 3.46 |
| Religious/motivational content | 3.71 |
| Peer lifestyle content | 3.95 |
Source: Research Data (2026)
The data presented on Table 4.8 highlights the emotional impact of different content types encountered by participants through digital platforms. It therefore reflects the role of algorithmic curation in shaping user experiences. The mean impact scores indicate that peer lifestyle content (3.95) and wealth and success content (3.89) exert the strongest emotional influence on respondents. This suggests that participants are particularly sensitive to content that evokes social comparison, status, and aspirational goals, which aligns with prior research indicating that algorithmically prioritized content often amplifies feelings of envy, desire, or motivation.
Religious and motivational content produced a moderate impact score of 3.71. This finding implies that while participants acknowledge and respond to inspirational content, its emotional influence is slightly less pronounced than that of peer-oriented or success-focused content. The slightly lower score may reflect the algorithmic balancing between engagement-driven content and more personal or reflective content, which users may interact with in a more selective or episodic manner.
Furthermore, political news received the lowest mean impact score of 3.46. This result suggests that, although participants are exposed to such information, it is comparatively less emotionally resonant. This could reflect algorithmic filtering that prioritizes sensational or peer-related content over political updates or a general user tendency to disengage from politically charged material, consistent with patterns of selective exposure in online media.
Generally, the findings underscore the significant influence of content algorithms on emotional experience, particularly in relation to social comparison and lifestyle evaluation. Algorithmic curation appears to reinforce exposure to content that maximizes engagement through emotional stimulation, while less interactive content, such as political updates, generates comparatively lower emotional responses. This highlights the dual role of algorithms: (a) shaping not only what users see but also how they feel, and (b) potentially affecting decision-making, perceptions of self-worth, and lifestyle aspirations.
4.9 Mental Health Outcomes
Table 4.9: Mental Health Effects of Social Media Use
| Outcome | Mean | Std. Deviation |
| Increased stress | 3.77 | 0.91 |
| Anxiety after prolonged use | 3.69 | 0.93 |
| Sleep disruption | 3.63 | 0.96 |
| Feeling connected and supported | 3.58 | 0.88 |
Source: Research Data (2026)
Table 4.9 presents the perceived mental health effects associated with social media use among participants. The data indicate that social media platforms have a measurable impact on both negative and positive aspects of mental health, reflecting the complex role of digital interactions in daily life.
Increased stress emerged as the most prominent negative outcome, with a mean score of 3.77 (SD = 0.91). This suggests that participants frequently experience stress as a result of their engagement with social media content. The stress may be linked to exposure to wealth, peer lifestyle, or political content, as discussed in Section 4.8, which can evoke social comparison, fear of missing out (FOMO), or cognitive overload.
Anxiety after prolonged use was the second-highest outcome, with a mean of 3.69 (SD = 0.93). This highlights a temporal dimension to negative mental health effects. It also suggests that extended periods of continuous engagement exacerbate feelings of worry or unease. Algorithms that continually prioritize engaging content may unintentionally contribute to prolonged exposure, thereby heightening anxiety.
Sleep disruption scored a mean of 3.63 (SD = 0.96). This result indicates social media use, especially during late hours, may interfere with rest patterns. Prior research has shown that screen time, notifications, and emotionally charged content can negatively affect sleep quality, which in turn amplifies stress and anxiety.
Interestingly, despite the predominantly negative outcomes, participants also reported feeling connected and supported, with a mean score of 3.58 (SD = 0.88). This underscores the dual nature of social media: while it can be a source of stress and anxiety, it also provides social support, access to communities, and opportunities for emotional connection. Such positive effects may be facilitated by interactions with friends, family, or online groups offering advice, empathy, or shared experiences.
These findings highlight that social media platforms exert multifaceted influences on mental health. While exposure to certain content and prolonged use can increase stress, anxiety, and sleep disruption, social media also serves as a valuable tool for social connectedness. These outcomes reinforce the importance of algorithmic transparency, digital literacy, and user strategies for mitigating negative effects while leveraging positive benefits.
4.10 Coping Strategies and Perceived Control
Table 4.10: Coping and Self-Regulation
| Item | Mean | Std. Deviation |
| Conscious effort to manage use | 3.44 | 0.94 |
| Feeling in control of usage | 3.21 | 0.98 |
| Desire for guidance | 3.92 | 0.86 |
Source: Research Data (2026)
Table 4.10 presents participants’ coping strategies and their perceived control over social media use. The data indicate that while users attempt to self-regulate their engagement, there are varying levels of perceived effectiveness and a notable desire for guidance.
The desire for guidance scored the highest mean at 3.92 (SD = 0.86), suggesting that participants recognize the challenges associated with managing social media use and actively seek external support or structured advice. This also highlights the role of educational interventions, digital literacy programs, and platform-level guidance tools in helping users navigate algorithmically curated content responsibly.
Participants reported a conscious effort to manage use, with a mean of 3.44 (SD = 0.94), an indication that many individuals engage in deliberate strategies to regulate their exposure (such as setting time limits, muting notifications, or avoiding certain types of content). This aligns with research on self-regulation, which suggests that deliberate behavioural strategies can mitigate the negative mental health effects associated with social media overuse.
Despite these efforts, the feeling of control over usage had a lower mean of 3.21 (SD = 0.98). This result reflects a perceived gap between intentions and actual behaviour. Participants may find it challenging to consistently manage engagement due to algorithmically personalized feeds, notifications, and content designed to maximize attention. This discrepancy between effort and perceived control underscores the influence of platform design on user behaviour. It also suggests that even motivated individuals can struggle to maintain healthy usage patterns without external support.
These findings generally reveal that participants are aware of potential risks associated with social media use and employ coping strategies to manage their engagement. However, the strong desire for guidance and relatively low perceived control indicate that individual efforts alone may be insufficient. These results highlight the need for a combination of user-centred strategies, educational interventions, and platform-level design modifications to enhance digital wellbeing and empower users to exert meaningful control over their social media experiences.
4.11 Conclusion
The integration of survey results and interview data shows strong alignment. High indulgence scores are supported by narratives describing habitual checking, economic pressure, and emotional attachment. This triangulation strengthens the validity of the findings and confirms that social media indulgence is a structural and emotional condition rather than a purely individual choice.
The next chapter discusses these findings in relation to existing literature and theoretical frameworks.
Leave a Reply